
Click Traffic
The per-click inspector — every ad click with status, IP, location, VPN flag, device, browser, and session signals.
The Click Traffic page is the per-click inspector. Every click on your ads shows up as a row, with the signals ClickFortify used to score it. This is where you investigate flagged clicks, look for patterns, and decide whether a Bad classification was right.
Open the page
In the sidebar, click Click Traffic.
Summary cards
Four cards across the top show the click data for the selected date range. Each shows a percentage change vs. the previous period.
| Card | Meaning |
|---|---|
| Total Clicks | All clicks tracked |
| Normal Clicks | Clean traffic |
| Suspicious Clicks | Flagged but not blocked |
| Bad Clicks | Confirmed fraud or invalid |
Filtering
Two filters above the table:
- Traffic Type — Ad Clicks, Organic / Direct Traffic, or All Traffic.
- Status — All, Normal, Bad, Ignored, or Suspicious.
The date range picker in the top-right scopes the whole page.
The table
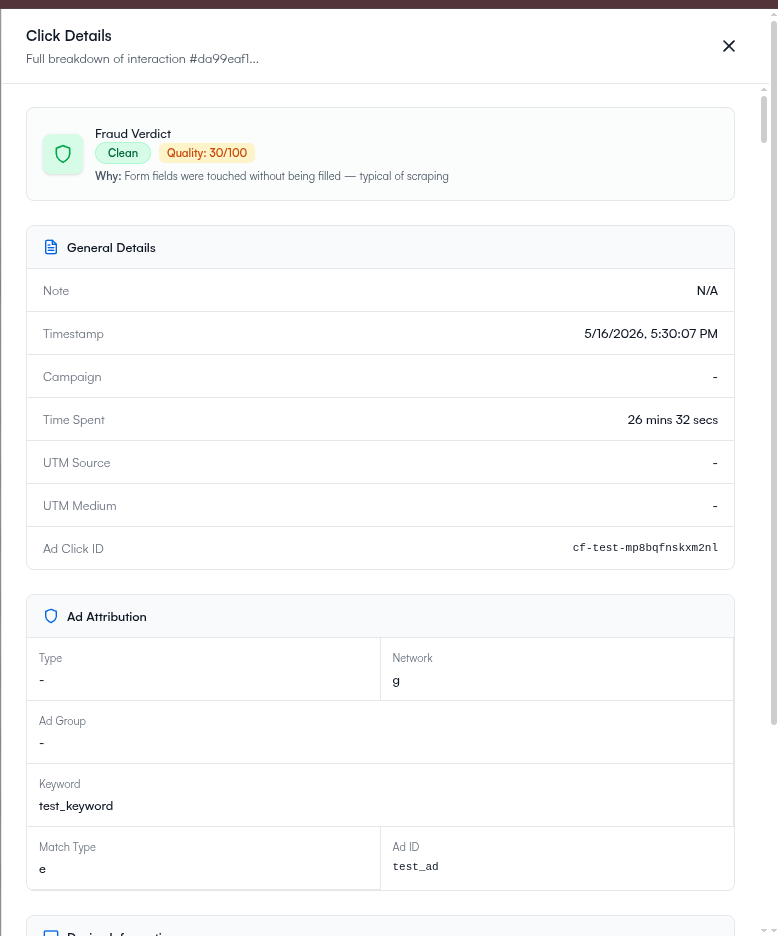
One row per click. Click any row to expand the full per-click signal detail.
| Column | What it shows |
|---|---|
| Time | Relative ("5 minutes ago") + absolute timestamp |
| Status | Normal (green), Suspicious (amber), or Bad (red) |
| Campaign | The Google Ads campaign that delivered the click |
| Ad Click ID | The Google gclid |
| Converted | ✓ or ✗ — whether this click led to a tracked conversion |
| IP Address | The source IP with usage classification (Business / Residential / etc.) |
| Location | Country and city with flag icon |
| VPN | Red indicator if a VPN or proxy was detected |
| Crawler | Bot detection result — "N/A" if not a known bot, otherwise the bot name |
| Time Spent | How long the visitor stayed on your site |
| Machine | Device type — Desktop / Mobile / Tablet |
| Browser / OS | Browser name + version, operating system |
| UTM Source / Medium | UTM parameters captured from the click |
Pagination: 10 rows per page; the footer shows the current range.
How to investigate
The most useful workflow:
Reading individual rows
When you expand a row, look for the combination of signals — not any single one:
- Short Time Spent + VPN + repeat IP — strong fraud signal.
- Long Time Spent + converted — almost certainly real.
- Bad status + converted — investigate. Either it's a false positive (lower sensitivity) or the conversion itself is fake (see Conversions for anomalous-timing flags).
- No
gclid— the click bypassed your tracking template. Check the tracking template configuration.
Suspicious clicks aren't blocked yet — they're monitored. If you see patterns in Suspicious that look like clear fraud, tighten protection sensitivity by one level and watch for a week.
Even Bad clicks aren't blocked retroactively when you're on Warn mode — Warn only adds the bad source to exclusion lists for future clicks. The current bad click in the table still got charged. If you want real-time blocking on detection, switch to Strict mode in Protection settings.
Best practices
- Check daily. New suspicious activity often shows up overnight.
- Compare campaigns. Some campaigns attract more fraud than others — Top Threat Sources on the Main Dashboard is the fastest way to spot which.
- Verify converting clicks. Suspicious clicks that converted are worth a second look — either a false positive worth whitelisting, or a fake conversion worth investigating.
- Use filters aggressively. Wide views give noise; narrow views give signal.
What happens next
- Conversions — see which clicks led to outcomes
- Reports — export the data for analysis or a refund claim
- Blacklist — manually block patterns you find here